With parsing in place, it's time to calculate the easy query.
As a refresher, the easy query is to get the ratio of the hourly volume-weighted average price between the Bitmex ("bmex") and GDAX ("gdax") exchanges. A Python implementation of how a single hour is calculated is here, and a SQL implementation is here.
One approach would be to parse all the rows into a Vec<Trade> and then compute the aggregation on that, but it would be pretty wasteful in terms of memory usage. There's no reason we can't compute the query in a single pass, assuming the CSV is sorted.
In a "data pipelines" situation, you can build in assumptions like the CSV file being sorted, since you have usually have control over the process. But, it's wise to verify the data matches the assumptions built in to the program to prevent accidental misuse. What if the program is still in use long after you've left the company where it was built by people who didn't write it, for example? Silent data corruption is much more dangerous than data munging program crashing on invalid input.
Hence, inside the parsing loop, we can add some code like:
let mut last_time = 0;

for row in csv {
    assert!(trade.time >= last_time);
    last_time = trade.time;
}
You can use debug_assert! or debug_assert_eq! in situations where you want to avoid the (small) performance overhead of the assert! calls in the final production binary. It's also possible to turn on debug assertions in a --release build (for instance if it would take too long to run the program in debug mode), by adding the following to your Cargo.toml:
[profile.release]
debug-assertions = true
In order to perform the query computations in one pass while we are parsing, we'll need to add some code to pull out the first row of the CSV before we enter our main loop. The purpose of this is so we can get the initial start hour to begin our query output with. We could start the query output at whatever time the first row is at, and at hour increments relative to that time, but that seems kind of cheap and lazy to me.
// pull out first row to initialize query calculations
rdr.read_record(&mut row).map_err(|e| format!("reading first row failed: {}", e))?;
let trade: Trade = row.deserialize(Some(&headers))
    .map_err(|e| {
        format!("deserializing first row failed: {}\n\nFailing row:\n{:?}", e, row)
    })?;

let mut cur_hour = trade.time - trade.time % ONE_HOUR; // start query calculations at top of hour
let mut next_hour = cur_hour + ONE_HOUR;

// accumulated sums, counts per hour

let mut bmex_total = if trade.exch == e!(bmex) { trade.price * trade.amount } else { 0.0 };
let mut bmex_amt = if trade.exch == e!(bmex) { trade.amount } else { 0.0 };
let mut n_bmex = 0 + (trade.exch == e!(bmex)) as usize;

let mut gdax_total = if trade.exch == e!(gdax) { trade.price * trade.amount } else { 0.0 };
let mut gdax_amt = if trade.exch == e!(gdax) { trade.amount } else { 0.0 };
let mut n_gdax = 0 + (trade.exch == e!(gdax)) as usize;
If we had more than two exchanges we were tracking, or if the program allowed the user to dynamically select which exchanges we were computing the ratio for, you'd definitely want something more flexible than four f64 variables to hold the hourly accumulations, but for now the variables will do fine.
If you are confused about the use of total and amt as the postfix used in the variable names: in currency markets, "amount" is generally used to refer to the quantity of currency in the base currency's denomination ("btc" in "btc/usd"), while "total" is the quantity of currency in the quote currency's denomination ("usd" in "btc/usd"). The "total" can be calculated by multiplying the "amount" by the price (and subtracting relevant fees, alas). So I just fell into old habits when naming those variables.
e! is a macro in the markets crate for creating an Exchange instance. In the case of e!(bmex), it expands to the code Exchange::bmex, the enum variant for the Bitmex exchange. There's also c!(usd) which expands to Currency::usd and t!(btc-usd) which expands to Ticker { base: Currency::btc, quote: Currency::usd }.
Finally, we need to open our output file so we can write each query row out as it is calculated, avoiding the need to store the results somewhere.
// initializing --output-path CSV
let wtr = fs::File::create(&opt.output_path)
    .map_err(|e| format!("creating output csv file failed: {} (tried to create {})", e, opt.output_path.display()))?;

let wtr = io::BufWriter::new(wtr);

let mut wtr = csv::Writer::from_writer(wtr);

wtr.write_record(&["time","ratio"]).map_err(|e| format!("writing CSV headers to output file failed: {}", e))?;
It's possible to get Csv to serialize a struct into a CSV row, but since we only have two columns, it doesn't seem worth it in this case.
Now, in the body of the main while loop over each CSV row, we need to add 1) code to filter out non btc/usd rows, 2) handling for the transition from one hour to the next, 3) accumulate operatations branched on which exchange the trade row is for:
while rdr.read_record(&mut row)? {
    let trade: Trade = // ...

    // ...

    if trade.ticker != t!(btc-usd) { continue }

    if trade.time >= next_hour { // finalize last hour, and prepare for this hour
        if n_bmex == 0 || n_gdax == 0 {
            wtr.write_record(&[
                &format!("{}", cur_hour),
                "NaN",
                "NaN",
                "NaN",
            ]).map_err(|e| format!("writing output row failed: {}", e))?;
        } else {
            let bmex_wt_avg = bmex_total / bmex_amt;
            let gdax_wt_avg = gdax_total / gdax_amt;
            let ratio = bmex_wt_avg / gdax_wt_avg;
            wtr.write_record(&[
                &format!("{}", cur_hour),
                &format!("{}", ratio),
                &format!("{}", bmex_wt_avg),
                &format!("{}", gdax_wt_avg),
            ]).map_err(|e| format!("writing output row failed: {}", e))?;
        }
        n_written += 1;

        // reset state
        bmex_total = 0.0;
        bmex_amt = 0.0;
        gdax_total = 0.0;
        gdax_amt = 0.0;
        n_bmex = 0;
        n_gdax = 0;

        cur_hour = next_hour;
        next_hour += ONE_HOUR;

        // if we are skipping hours in between the last and current row, we
        // need to write a NaN row for the hours that had no data
        while next_hour <= trade.time {
            wtr.write_record(&[
                &format!("{}", cur_hour),
                "NaN",
                "NaN",
                "NaN",
            ]).map_err(|e| format!("writing output row failed: {}", e))?;

            n_written += 1;
            cur_hour = next_hour;
            next_hour += ONE_HOUR;
        }
    }

    match trade.exch {
        e!(bmex) => {
            bmex_total += trade.price * trade.amount;
            bmex_amt += trade.amount;
            n_bmex += 1;
        }

        e!(gdax) => {
            gdax_total += trade.price * trade.amount;
            gdax_amt += trade.amount;
            n_gdax += 1;
        }

        _ => {}
    }

    // ...
}
(In case you are wondering about the "extra" columns: for diagnostic purposes, I end up writing three data columns: "ratio", "bmex", and "gdax", the latter two of which are the size-weighted prices for each exchange.)
Performance summary:
| Query | Easy |
| Hardware | i3.8xlarge |
| Elapsed time | 7min, 42sec |
| Throughput (rows/sec) | 1.97 million |
| Peak memory usage | 10MB |
Considerable improvement on a different instance type:
| Query | Easy |
| Hardware | z1d.metal |
| Elapsed time | 5min, 19sec |
| Throughput (rows/sec) | 2.85 million |
| Peak memory usage | 10MB |
Here's a look at the data generated:
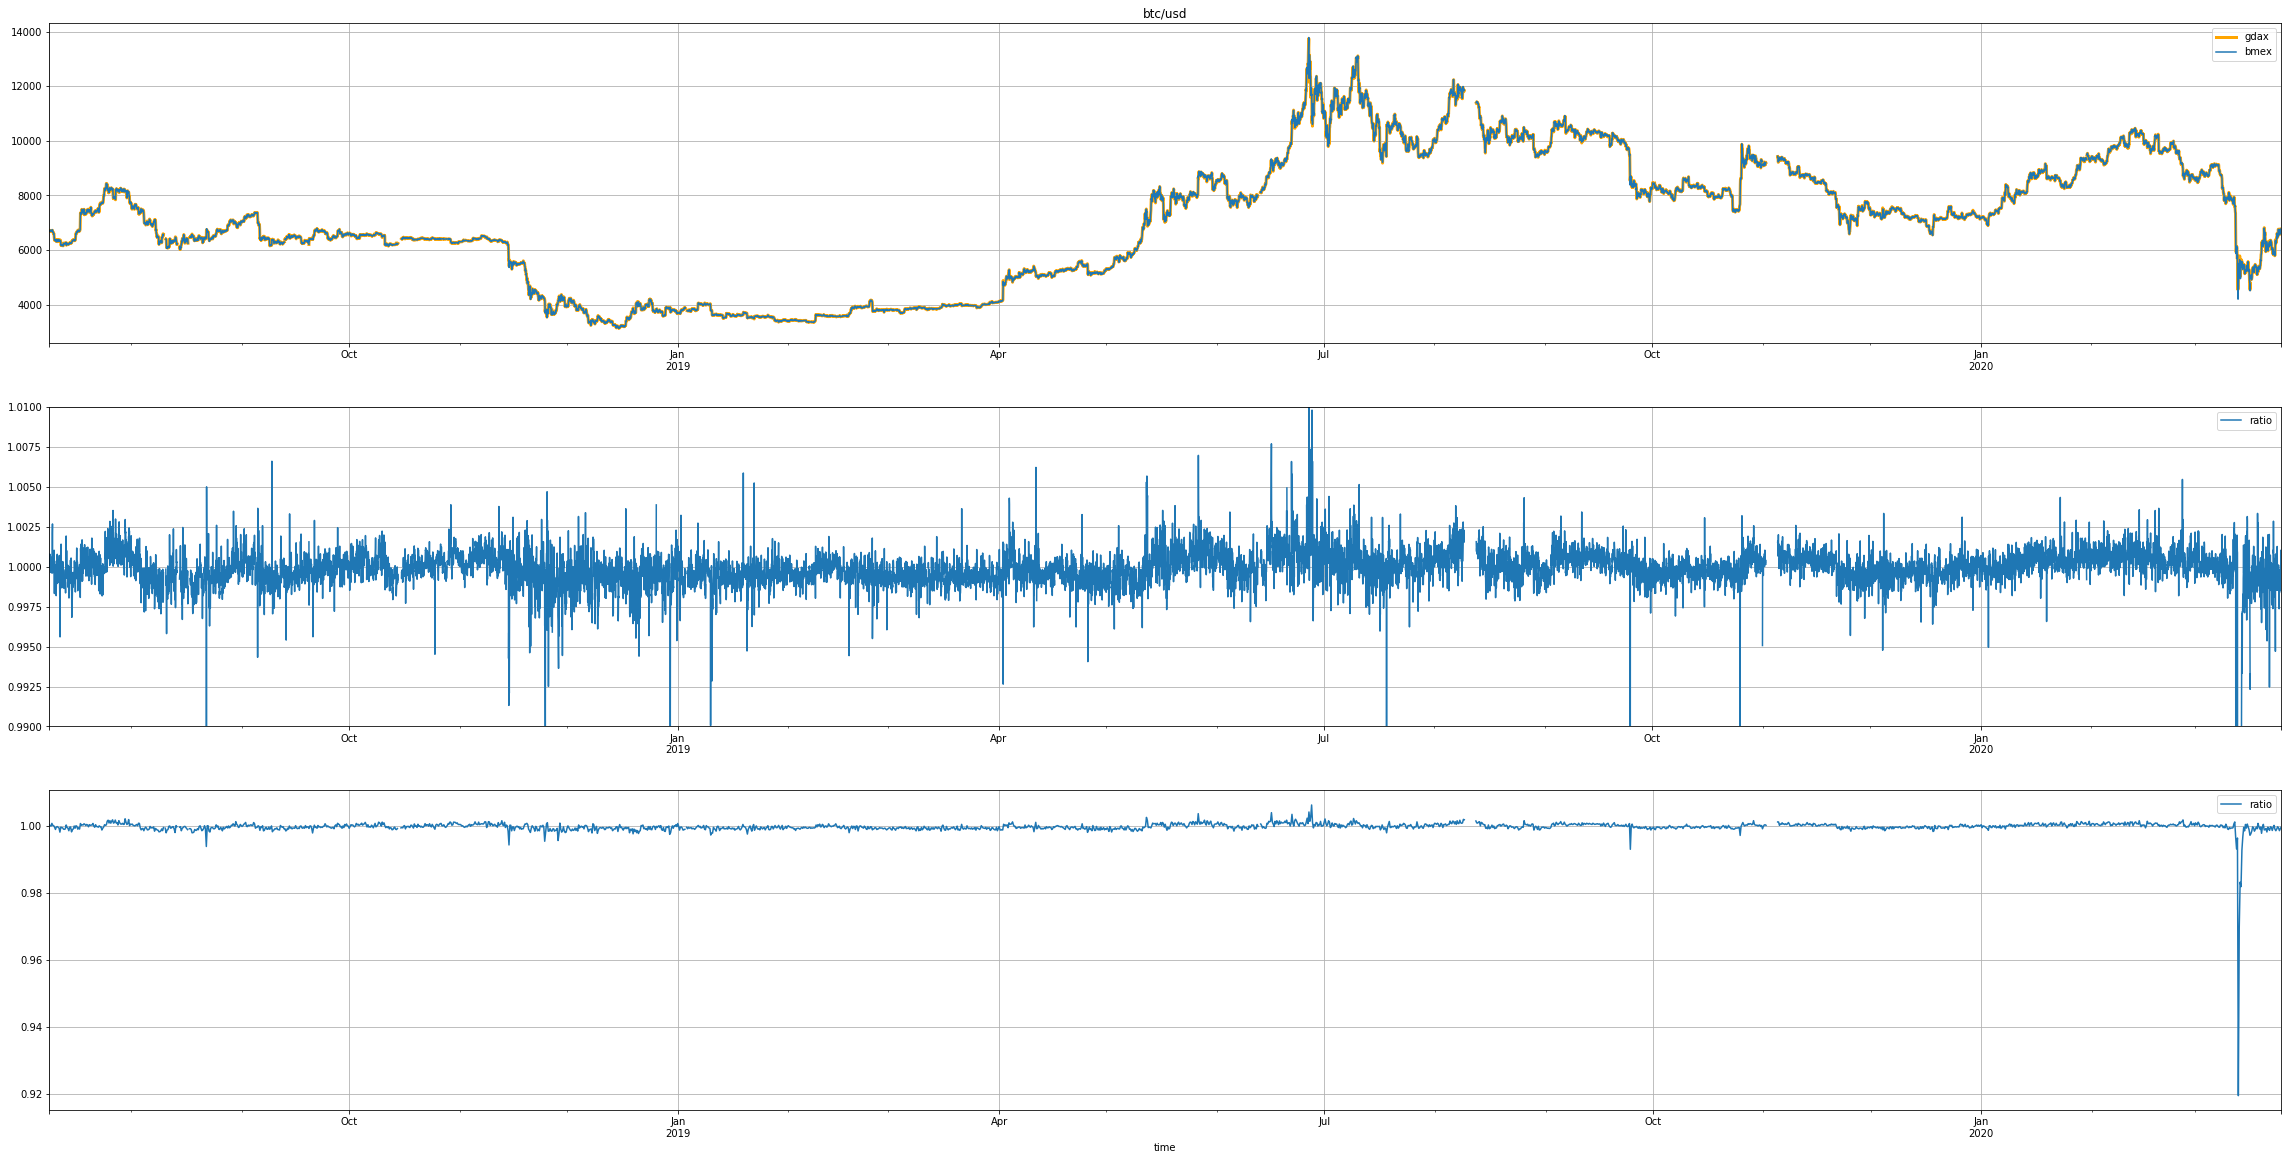
Time-series chart of the btc/usd price (top) and the bmex:gdax ratio (middle, bottom). The middle chart is a zoomed-in view, the bottom chart shows the very sharp plunge towards the end of the data.